“Through this work, I have a deep understanding of prisons, but I am not a proponent of using mass incarceration to “cure” society’s ills. I have found that
incarcerating people rarely addresses underlying causes and conditions such as poverty, trauma, addiction and mental illness. Much more often, it compounds
them.”
Christopher Poulos, author of What I learned visiting Alaska’s only maximum-security prison
This project identifies and characterizes prison facilities in the United States. Most or all federal, state, tribal, and military prisons are already in our database, and we're identifying which of these are used as immigration (ICE) holding facilities. Private prisons are shown regardless of whether the inmates are there because of federal or state convictions, juvenile detention, or immigration cases.
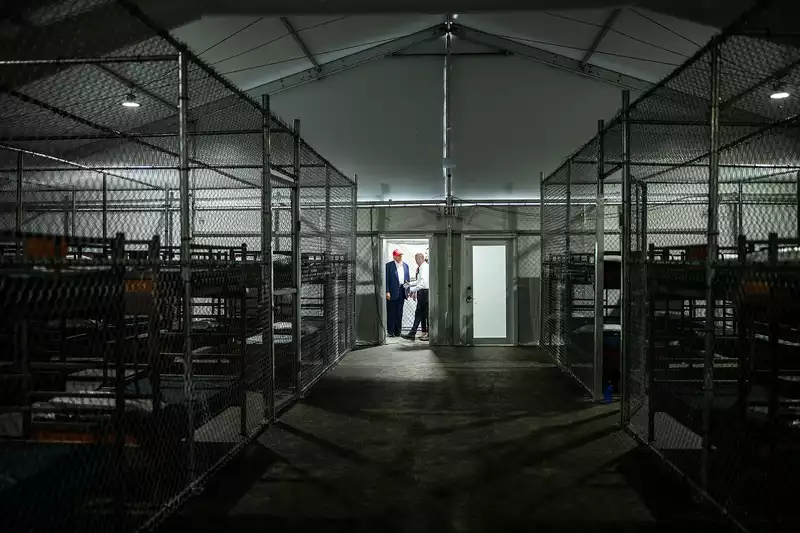
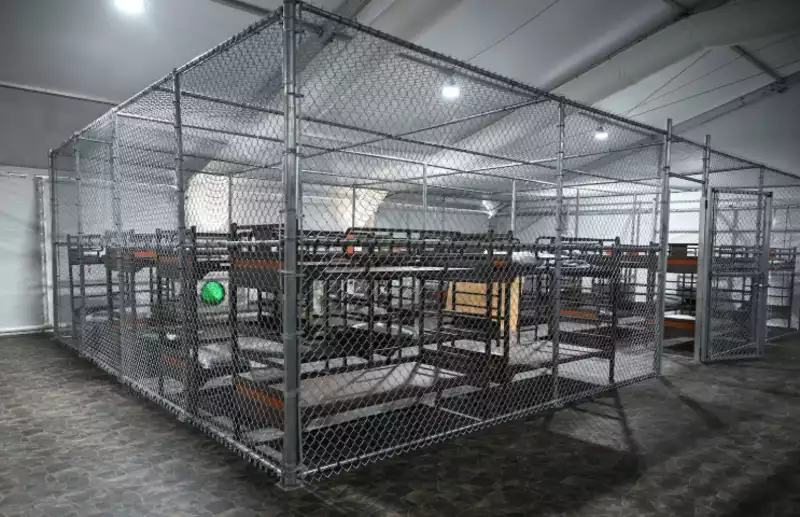
A small portion of the roughly 1600 facilities that have been used by ICE to house people in immigration-related cases are shown here. We're adding the rest as we have the resources. We're adding county and city jails as quickly as we can. Also not shown are all the other facilities that are part of the prison industry. For example, the thousands of federal and state probation offices.
You can help in one of two ways:
These buttons take you to the project's results so far.
Incarcerated Americans
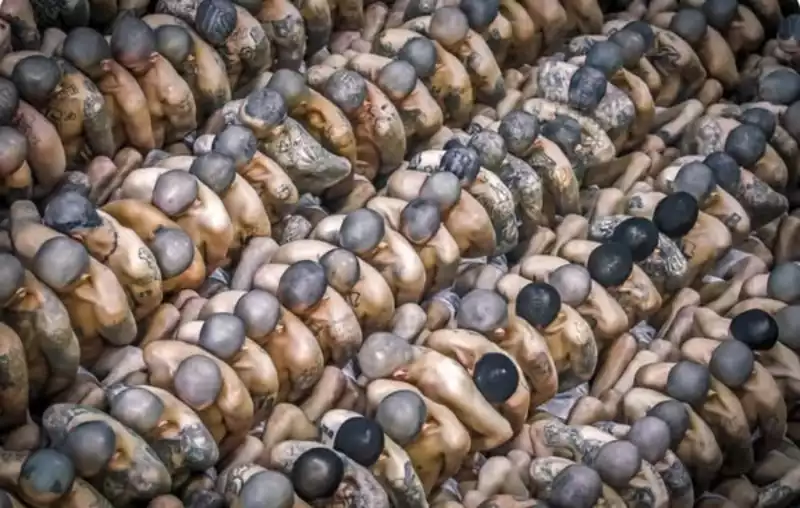
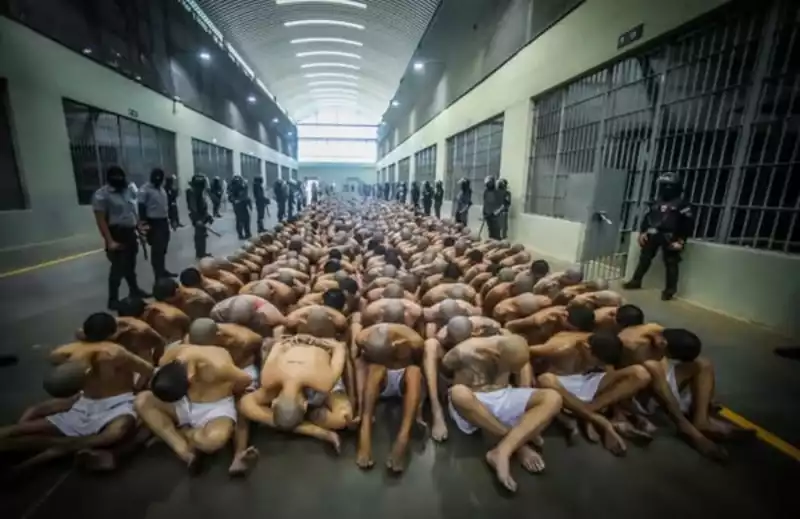
The United States incarcerates people at a percentage greater than any other country on Earth. For every 100,000 people, 639 are imprisoned. Plus, many U.S. prisons are now in private hands, thus incentivising that incarceration.


Timeline
Post-Civil War (1870) | Most state felony disenfranchisement laws are created, along with poll taxes, and literacy tests in an attempt to keep Black men from voting. |
1901 | Alabama's “moral turpitude” added to State Constitution |
1971 | Richard Nixon declares War on Drugs |
1974 | Richardson v. Ramirez held that convicted felons could be barred from voting without violating the Fourteenth Amendment to the Constitution. |
1983 | Corrections Corporation of America (CCA) formed as the first private corrections company. |
1984 | Sentencing Reform Act - dropped rehabilitation as one of the goals of punishment |
1997 | Massachusetts votes to revoke the right to vote while incarcerated. |
Felony Disenfranchisement by State
This table shows the percentage of eligible voters who are not allowed to vote because of felony disenfranchisement (FD). The fifteen states with the highest disenfranchisement are shown.
The “Con” column shows the states' conservative ranking, illustrating that felony disenfranchisement tends to be favored more by conservative states. The “ED” column shows the states' ranking in educational outcomes.
State | FD | Con | ED |
---|---|---|---|
Mississippi | 10.55% | 1 | 50 |
Tennessee | 9.09% | 8 | 40 |
Alabama | 8.94% | 2 | 47 |
Florida | 7.69% | 26 | 27 |
Virginia | 6.00% | 35 | 8 |
Kentucky | 5.92% | 18 | 48 |
Arizona | 4.86% | 24 | 31 |
Arkansas | 3.97% | 9 | 50 |
Georgia | 3.79% | 15 | 24 |
Texas | 2.80% | 23 | 28 |
Idaho | 2.72% | 14 | 38 |
Wyoming | 2.64% | 3 | 42 |
Louisiana | 2.23% | 6 | 49 |
South Dakota | 2.10% | 5 | 34 |
Missouri | 2.08% | 10 | 33 |
Additional reading
What Can We Learn From the History of Felony Disenfranchisement?
Number of People by State Who Cannot Vote Due to a Felony Conviction
THE CIA-Contra-Crack Cocaine Controversy
Cocaine, Conspiracy Theories & the CIA in Central America
WaPo: CONSPIRACY THEORIES CAN OFTEN RING TRUE
Netflix Doc: CIA Flooded Black Communities With Crack
Settlement Marks Step Toward Ending Abuses At For-Profit Immigrant Prisons